When proposing a unified, logic-driven labelling system, the most compelling argument you can make is quantitative: “We eliminate X redundant label templates now and establish controls that stop uncontrolled template creation going forward.”
But to carry that argument credibly across Operations, Quality, and IT, you need a data-driven validation approach grounded in your own environment. Below is a structured roadmap – with examples, caveats, and infographics you can pull – to make that validation rigorous and persuasive.
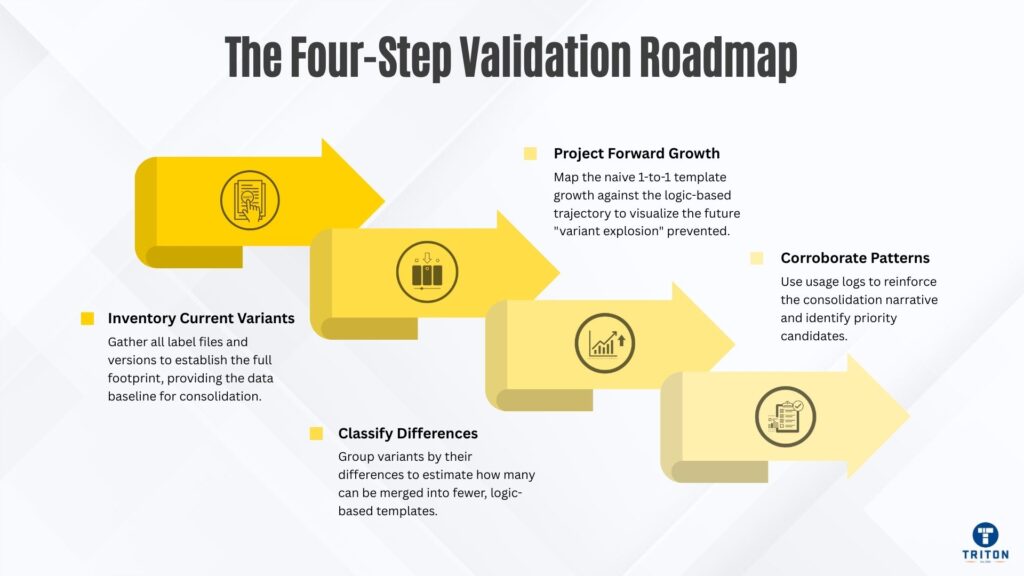
Step 1: Inventory Current Label Variants
Your first task is to trace the full footprint of your current label template set. Without a reliable baseline, any consolidation claim is speculative.
Actions:
Gather all label files and versions Search network drives, shared folders, backup archives, and design tools for all label template files (e.g. .btw, .btwx, .ltx, other proprietary formats). Don’t forget “shadow” templates used by business users but not centrally managed.
Capture template metadata
For each template, record key attributes in a master spreadsheet or database:
Template ID
Associated SKU(s)
Region(s) / Language(s)
Compliance Blocks Used
Layout / Orientation Differences
Last Modified / Owner
TPL_001
SKU-A, SKU-B
US / CA / MX
None
Portrait, 80×120 mm
2024-06 / Ops team
TPL_002
SKU-A
US / FR / ES
GHS pictogram block
Same layout
2024-04 / Dev team
TPL_003
SKU-C
Global
UDI + GHS
Landscape, 120×100 mm
2023-12 / QA
This inventory gives you the denominator – how many distinct templates you maintain today.
Tag usage/print frequency
If your logging or print history allows, annotate how often each template is used (e.g. prints per month). Rare templates are prime consolidation candidates.
Step 2: Classify Variants by Degree of Difference
Not every template difference is irreducible. Some differences can be absorbed via logic or modules. Your job here is to classify and estimate which templates can be merged and which must stand alone.
Approach:
Define the difference categories Examples:
Minor variations – language, optional block inclusion, minor footers
Group templates accordingly For each classification, count how many templates belong.
Estimate consolidation potential per group
Decide whether each group could be served by a single “intelligent” template (or a small number), using conditional logic or modular inclusion.
Example classification table
Difference Group
Number of Templates
Mergeable via Logic?
Estimated Merged Equivalent
Language variants (EN/FR/ES)
120
Yes
1
GHS / non-GHS variants
45
Yes
2
Logo/branding variant
30
Maybe
1.5
Layout/form changes
20
No
20
Speciality size differences
10
No
10
Total
225
–
34.5 (≈ 35 templates)
From this, you derive a consolidation factor: current 225 → ~35, meaning ~84 % reduction in template count.
You now have an empirically rooted estimate of how many templates you might eliminate simply by redesigning for logical variation.
Step 3: Project Forward Over SKU Growth
Having derived a current consolidation estimate, map two trajectories over your SKU growth history:
Naive trajectory: assume 1-to-1 mapping of new SKU (or variant) to new template
Logic-based trajectory: assume you sustain the same consolidation ratio for future growth
Example forecast table
Year
SKUs
Naive Templates
Estimated Logical Templates
2019
200
200
40
2020
280
280
56
2021
400
400
80
2022
640
640
128
2023
1000
1000
200
2024
1600
1600
320
2025
2560
2560
512
Plotting this gives a visual “variant explosion” where the naive line is straight upward, but the logic-based line grows much more gently. The divergence magnifies as SKU volumes scale.
Step 4: Corroborate with Empirical Usage and Maintenance Patterns
Draw supporting evidence from usage and maintenance logs to ground your consolidation model in reality and head off scepticism.
Key data points
Template usage frequency: Identify templates printed below a threshold (e.g. < 5 per month). These are consolidation candidates or candidates for deprecation.
Support / Edit history: Templates with frequent edits, patches, or bugfixes reflect complexity. These should be flagged as a consolidation priority.
Version count and drift: If templates diverge subtly over time (e.g. one variant is copied and modified), that indicates sprawl. You can often refactor those into a single template with logic.
Error/reprint statistics: Templates associated with higher reprint or error rates may indicate unstable or overburdened templates. Consolidating variants under stable logic reduces the error surface.
These usage and stability signals reinforce the consolidation narrative: you’re not just modelling-you’re responding to lived pain points.
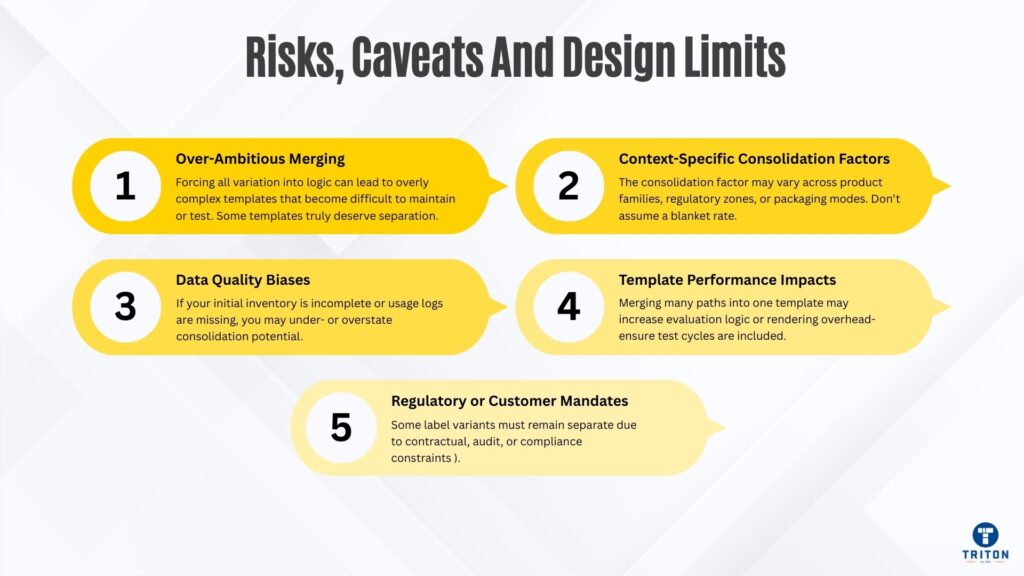
Risks, Caveats, and Design Limits
While this validation approach is powerful, be alert to pitfalls.
Over-ambitious merging: Forcing all variation into logic can lead to overly complex templates that become difficult to maintain or test. Some templates truly deserve separation.
Context-specific consolidation factors: The consolidation factor (e.g. ~84 % reduction in example) may vary across product families, regulatory zones, or packaging modes. Don’t assume a blanket rate.
Data quality biases: If your initial inventory is incomplete or usage logs are missing, you may under- or overstate consolidation potential.
Template performance impacts: Merging many paths into one template may increase evaluation logic or rendering overhead-ensure test cycles are included.
Regulatory or customer mandates: Some label variants must remain separate due to contractual, audit, or compliance constraints (e.g. country-specific language laws, exclusive artwork restrictions).
Case Study - Krka
Krka, a multinational pharmaceutical firm, used a unified labelling system to eliminate duplicate templates and reduce template maintenance. Their implementation allowed business users (not just IT) to compare templates, rationalise near-duplicates, and consolidate into fewer master templates. As a result, they report simplified change management, improved consistency, and lower maintenance overhead.
Similarly, in label consolidation consulting, firms like Pragmatyxs have audited hundreds of label formats and built catalogue reference templates to drive consolidation across diverse product lines.
These real-world cases validate that even complex, regulated environments like pharmaceutical labelling benefit from significant template reduction through structured rationalisation.
Conclusion & Next Steps
Template consolidation shifts label management from reaction to action. The four-step validation process-inventory, classify, project, corroborate-gives you the evidence to retire hundreds of templates while controlling growth.
Begin with a template audit, quantify your consolidation ratio, and project savings across your growth timeline. Present this data to stakeholders alongside case studies from Krka and others. You eliminate templates, cut maintenance costs, and strengthen compliance control. For labelling solutions that support consolidation, visit Triton Store.